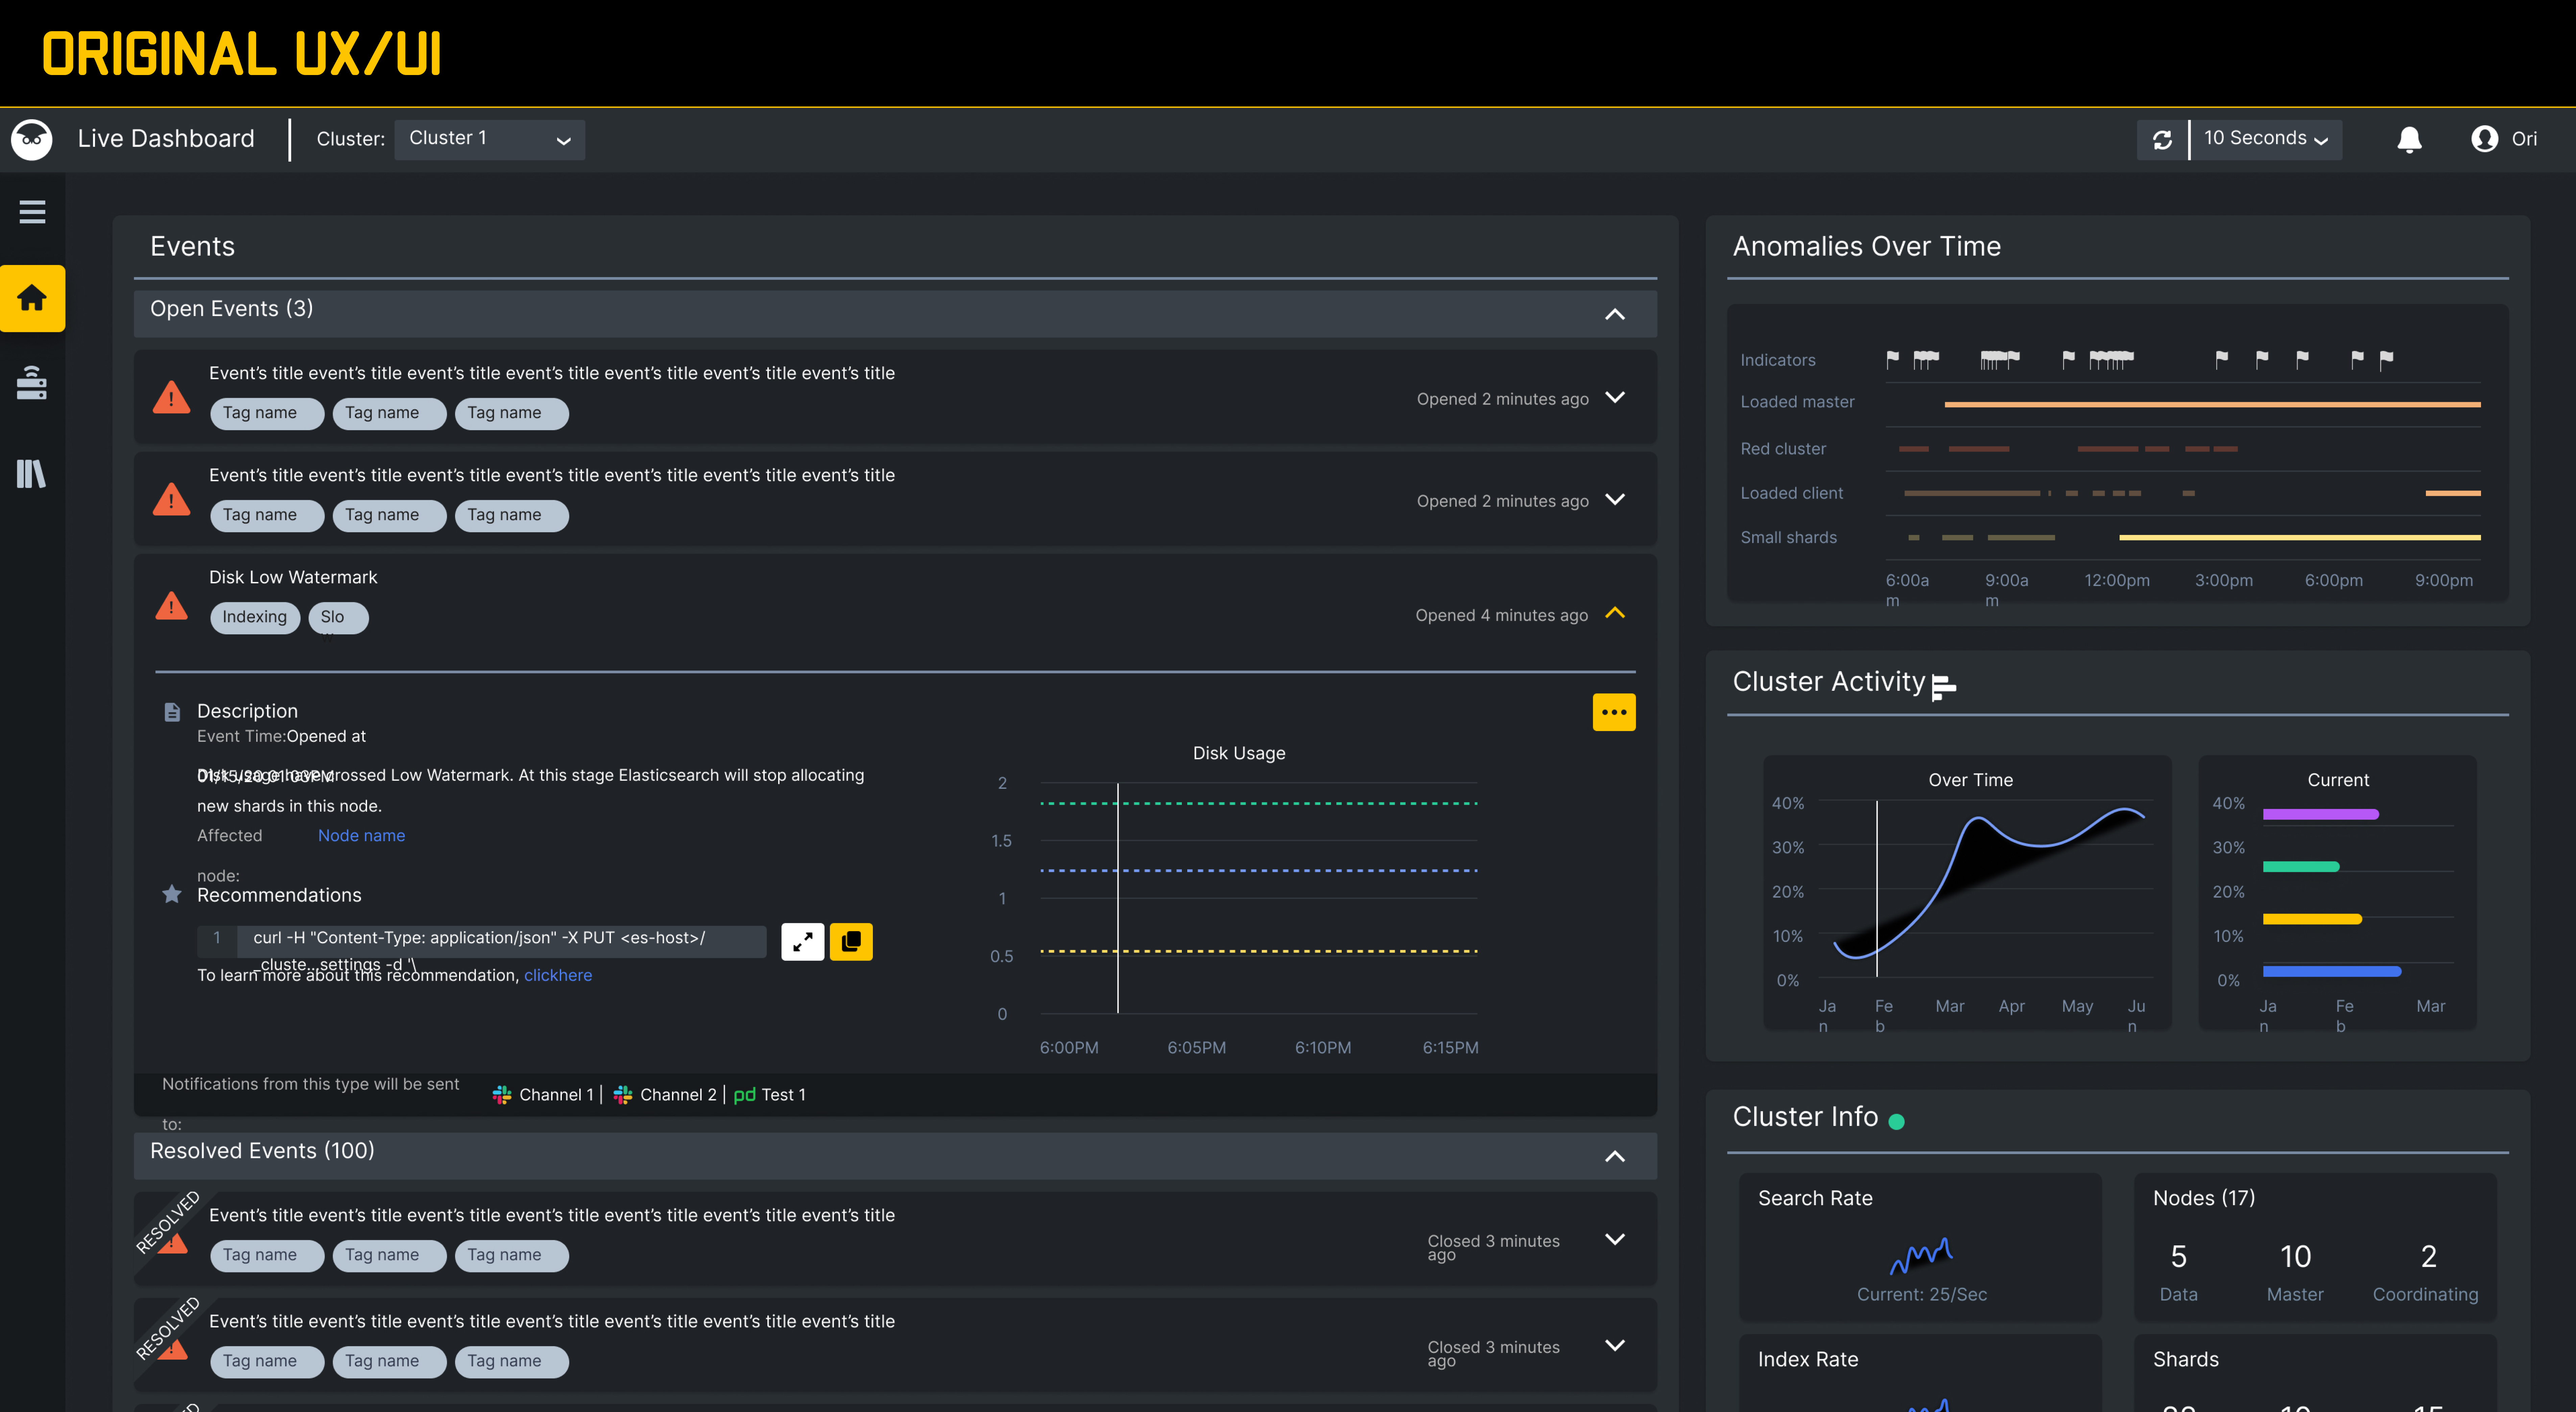
Auto-Ops Dashboard.
An operations surface for cluster observability that improves triage speed and decision quality under pressure.
An operations surface for cluster observability that improves triage speed and decision quality under pressure.
A centralized dashboard for cluster observability that helps operations teams identify high-priority issues faster and act with stronger context.
Led UX strategy and product design delivery across discovery, information architecture, dashboard interactions, and implementation-ready specs.
How we moved from a fuzzy problem to a shipped solution.
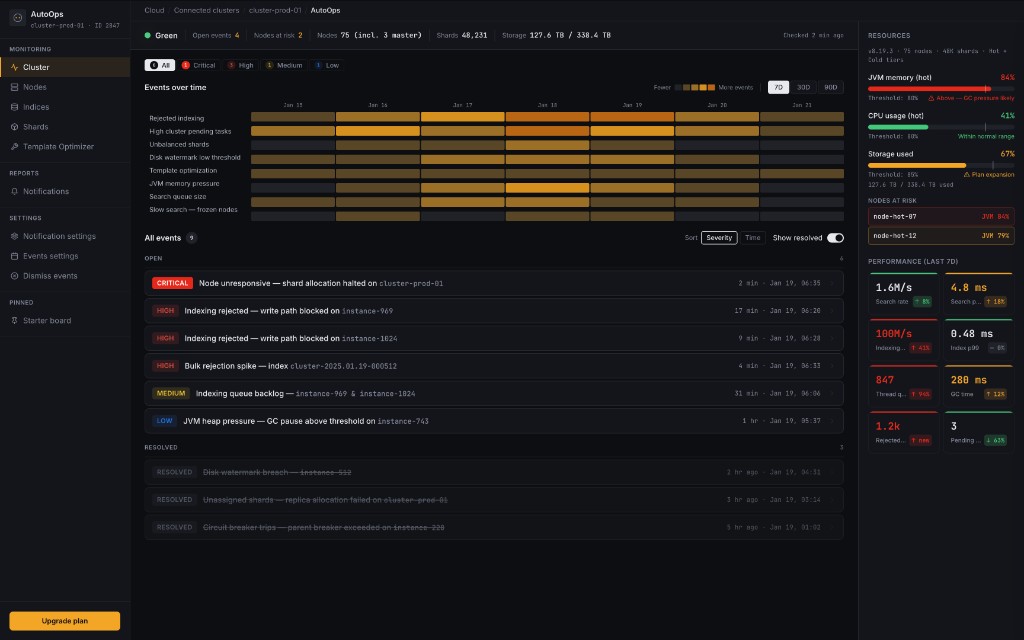
Operators were switching across tools to correlate health signals, which delayed triage and reduced confidence in next-best actions.
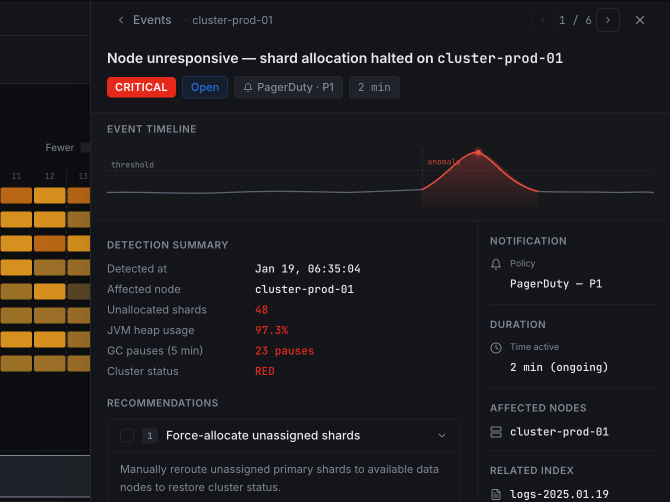
Build a dashboard that highlights urgency, clarifies causality, and supports quick drill-down actions under time pressure.
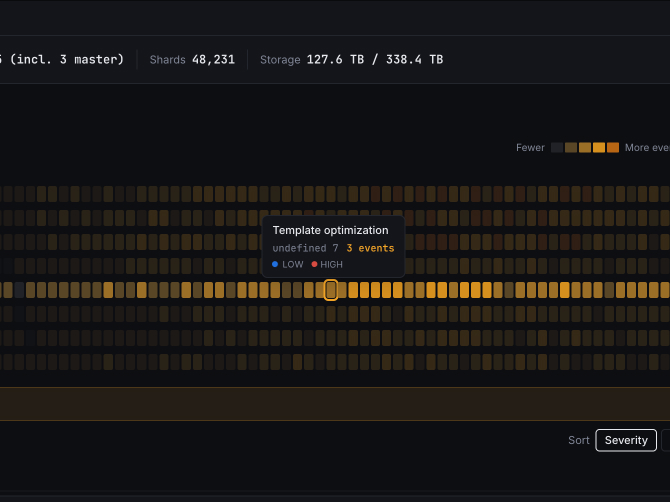
We analyzed monitoring workflows and incident handoffs to map bottlenecks in triage. Teams needed clearer prioritization, tighter context, and less visual noise.
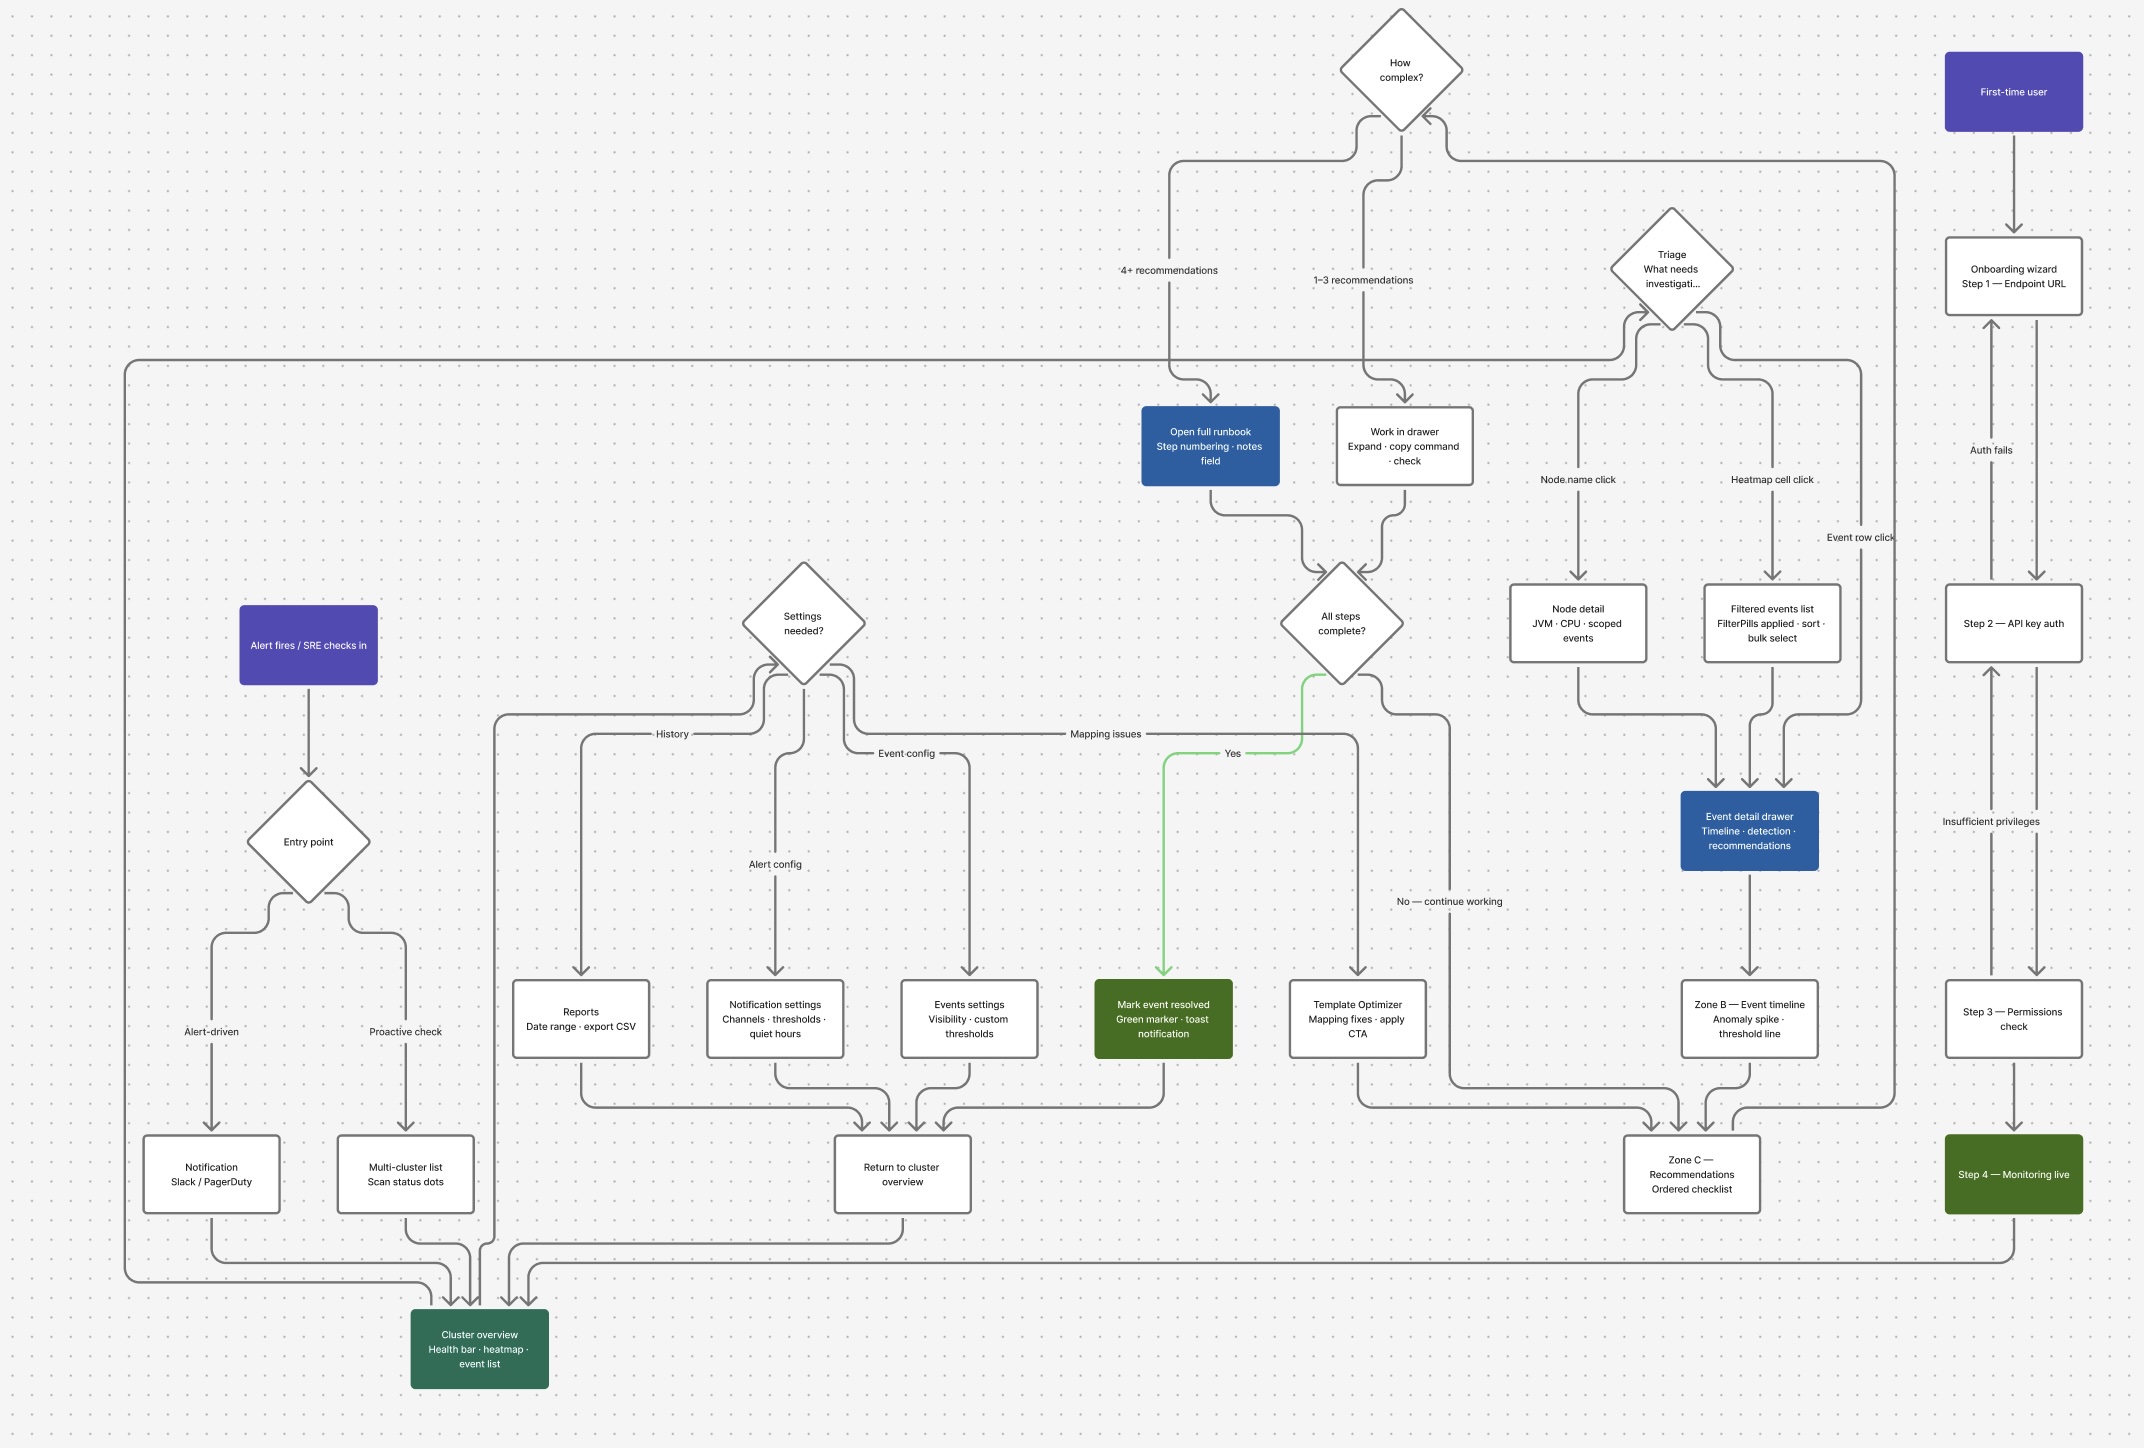
Wireframes tested hierarchy and triage-first patterns for alert context, risk scoring, and actionability. We validated the fastest route from signal to decision.
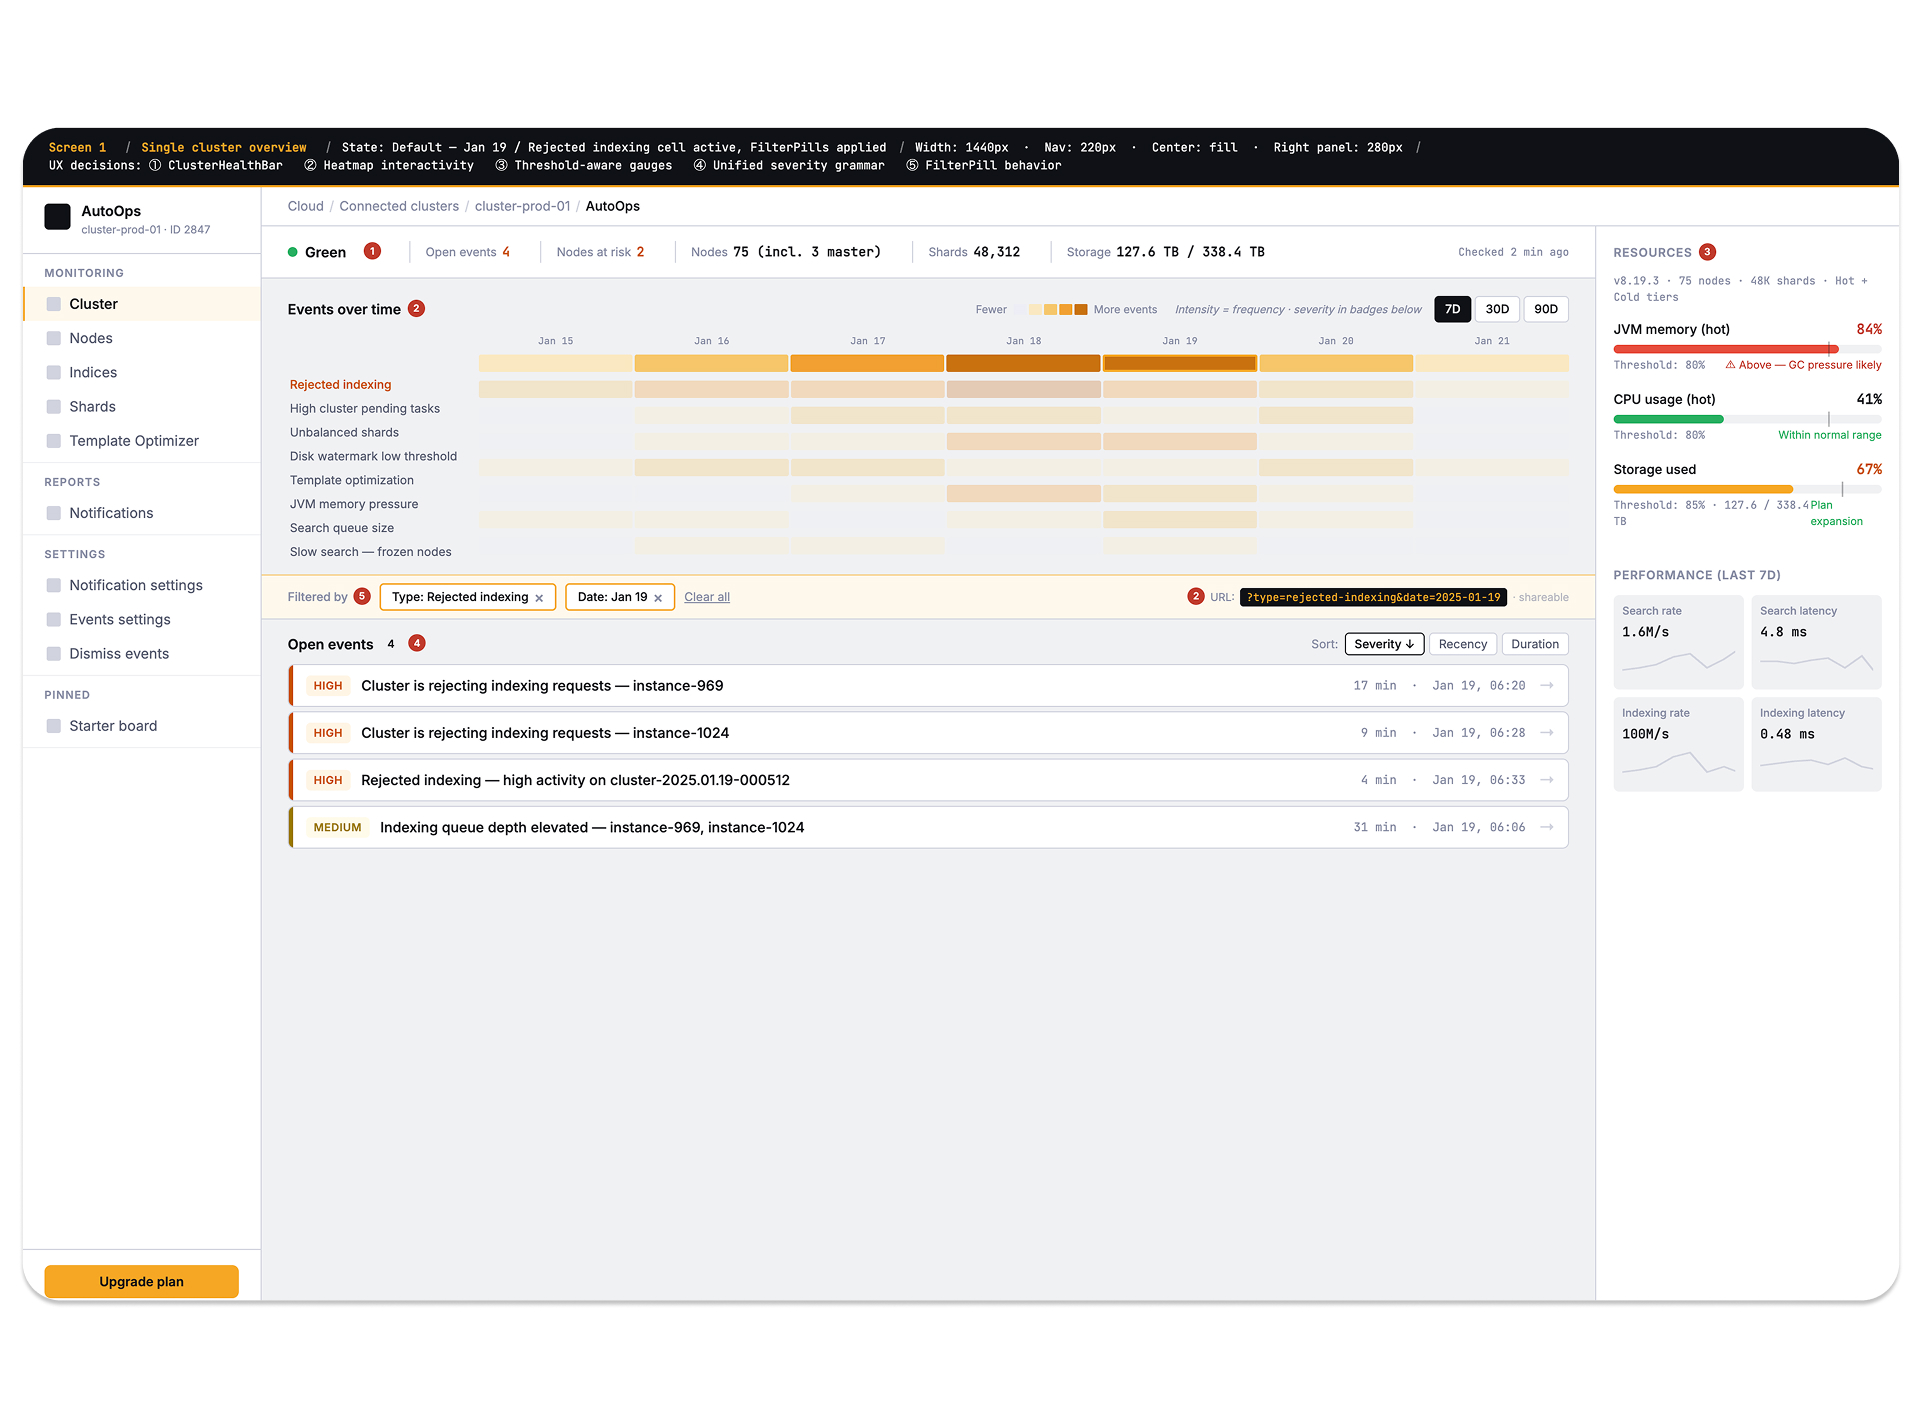
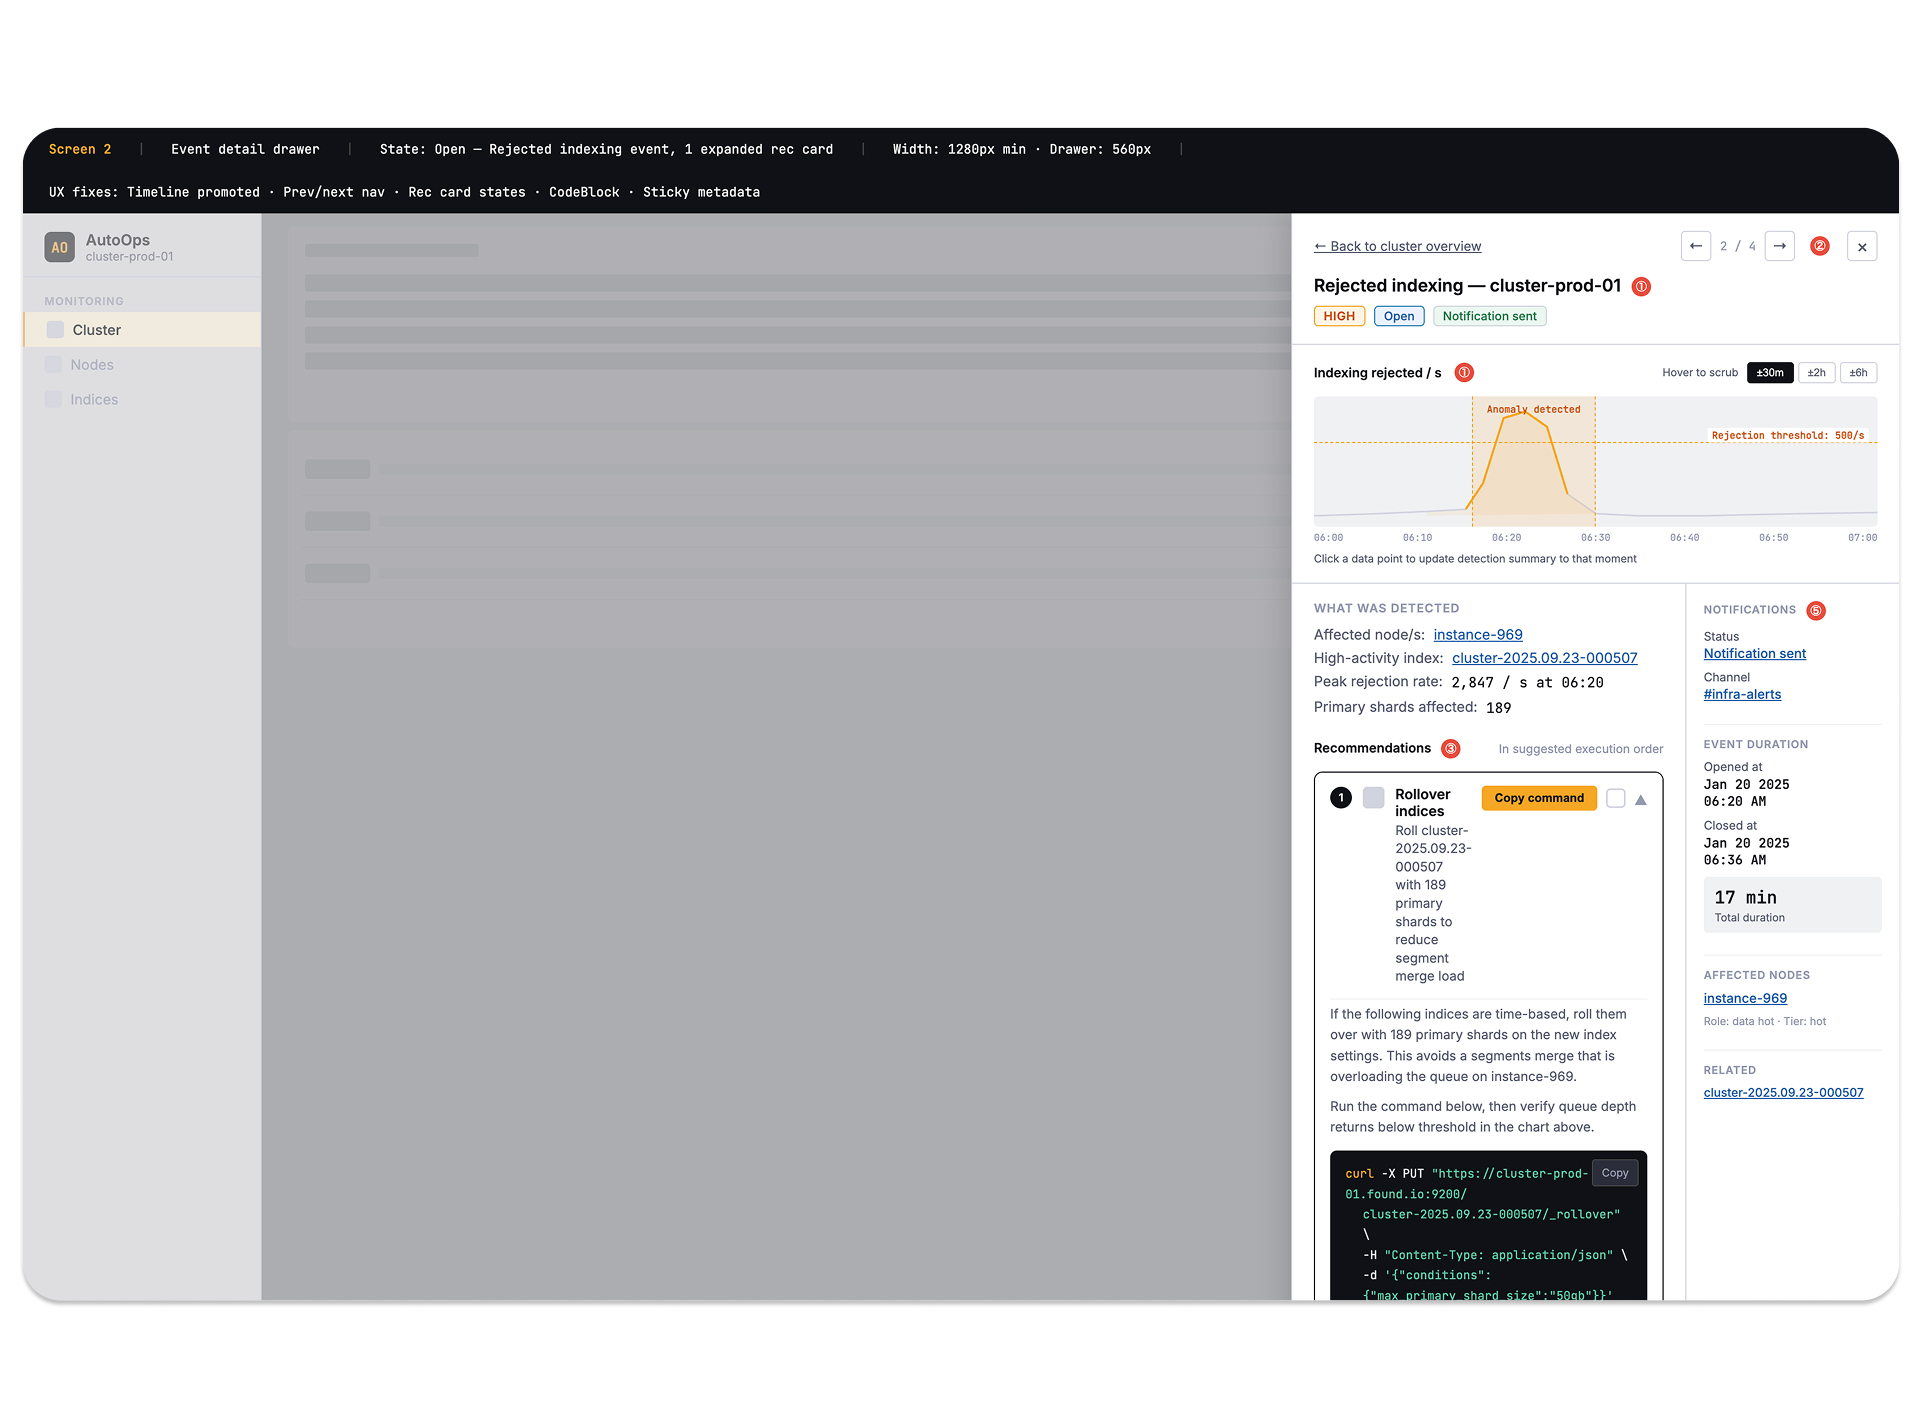
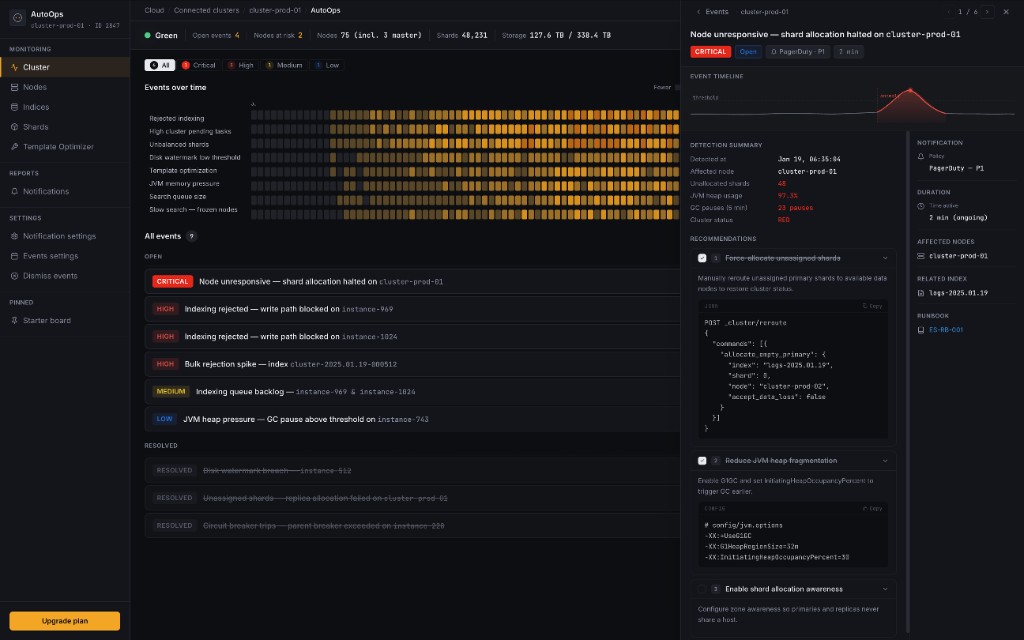
The dashboard improved issue prioritization and reduced navigation overhead by centralizing critical observability context. Mean time to detection dropped from ~18 minutes to under 2 minutes, cutting alert fatigue by 35%. Severity-based triage surfaced the right incidents without manual filtering, saving SRE teams 3–4 hours daily. Incidents resolved 45–70% faster through contextual runbooks and copy-ready remediation commands. Multi-cluster visibility consolidated into a single pane, reducing downtime from ~2.3 hours/month to under 25 minutes.